


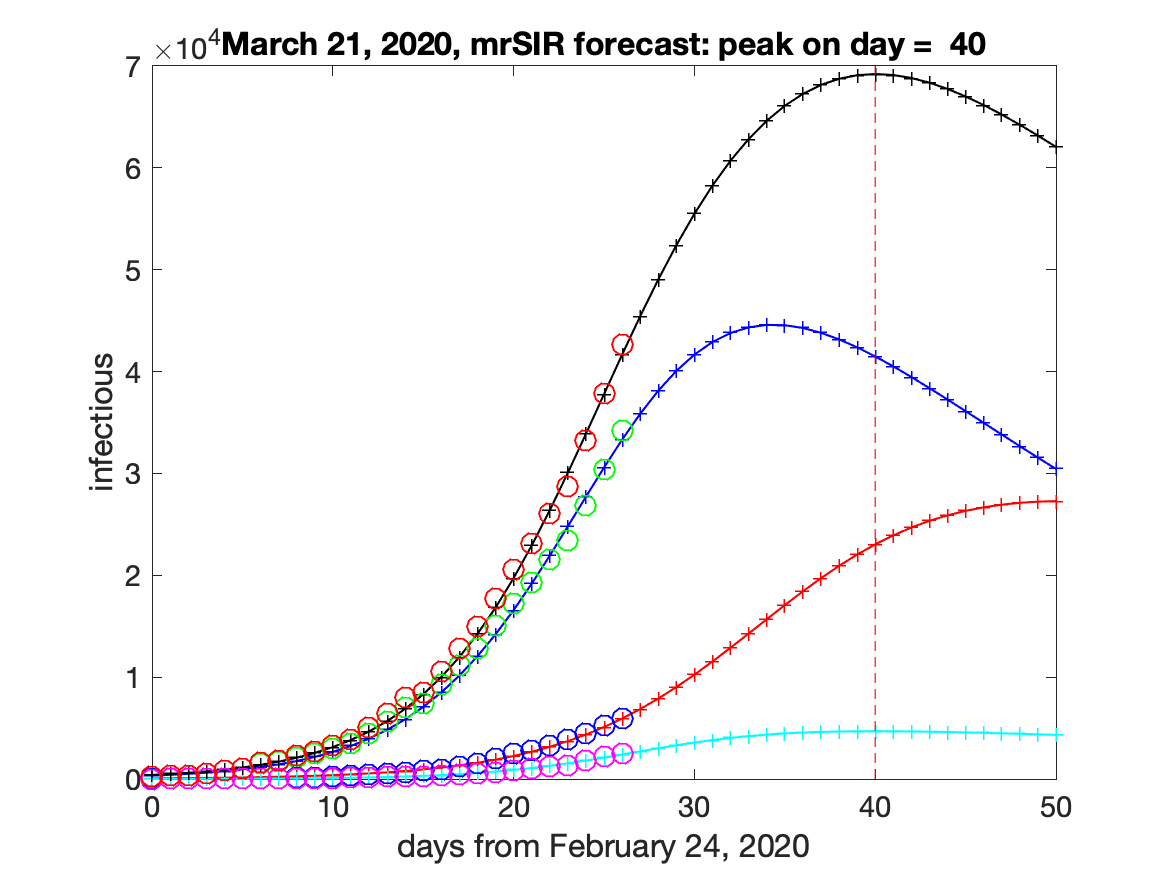


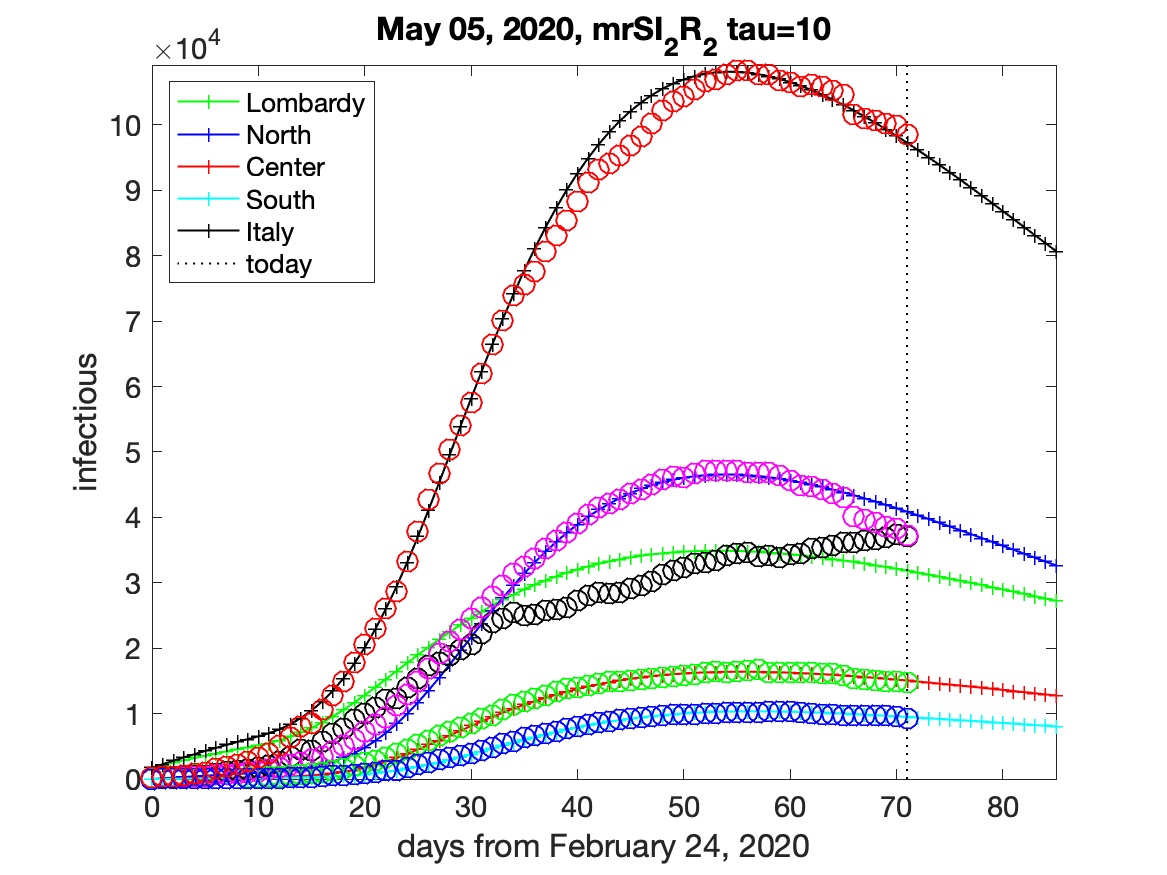

a forecast including the total cases can be found here
|
|
|
|
|
|
|
|
|
|
|
|
|
|
|
|
|
|
|
|
|
|
|
|
|
|
|
|
|
|
|
|
|
|
|
|
|
|
|
|
|
|
|
|
|
|
|
|
|
|
|
|
|
|
|
|
|
|
|
|
|
|
|
|
|
|
|
|
|
|
|
|
|
|
|
|
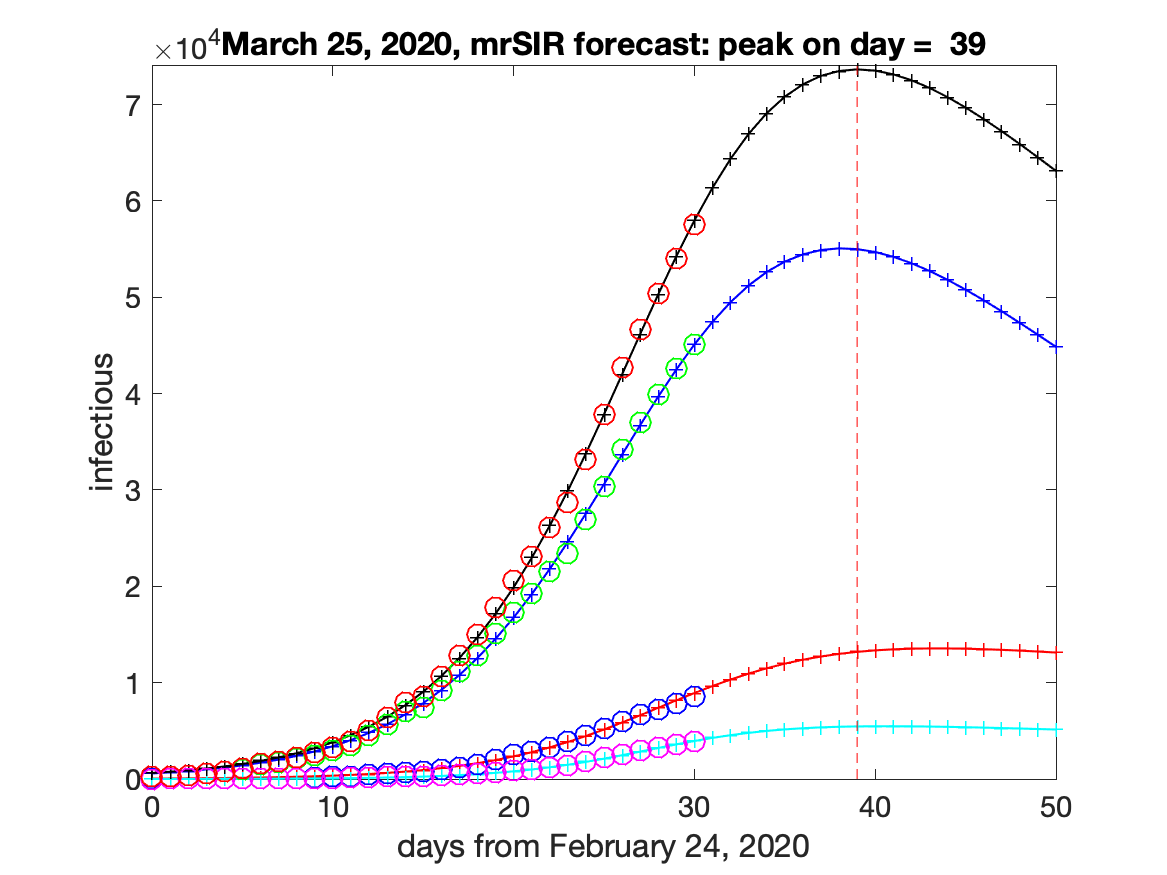
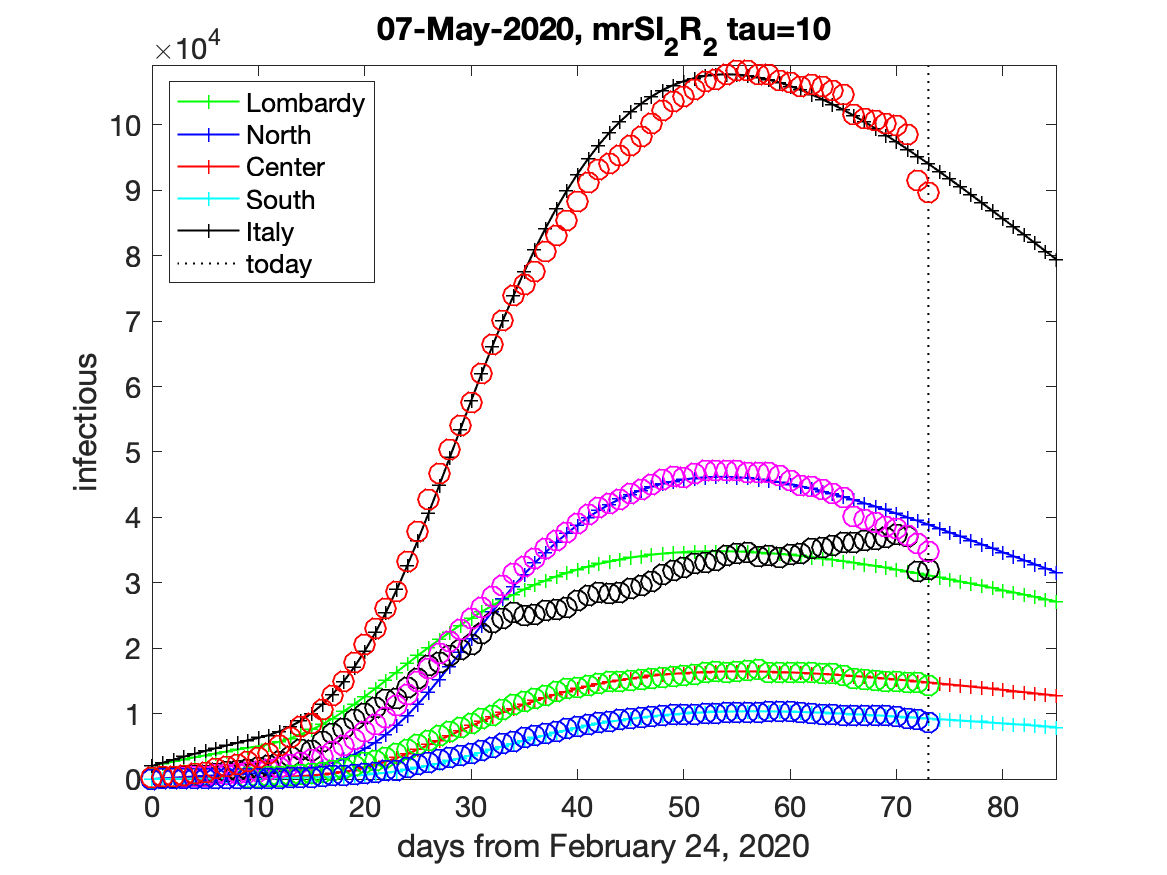
a forecast including the total cases can be found here |
|
| Disclaimer. | Thanks to Arcangelo Labianca and Matteo Marulli for collecting and sharing data |